
I had an application that required loading some images and performing operations on them. Depending on the size of the images, the memory requirements of the application could make the whole system crash. This needed to be stopped… or at least understood.
Looking around, I found several tools to diagnose my problem, and I tried 2.
Pympler
Pympler is a tool to analyze the memory usage of your application. Most of it is a wrapper over other applications specialized on some specific diagnostic.
I used two of the tools it provided: asized and tracker.
asized measures the memory used by the passed object. It has several options you can inspect on the documentation to tune the way you want it to measure, but for me the defaults worked.
You use it like this:
print(asizeof.asized(obj, detail=10).format())
This gives you the size in bytes of that object, so you can know if something that should have been released is still in use. In my case I was holding a reference to an image inside one of my objects, and I was not aware of it until I checked the size of my object on a couple places where it should be almost empty.
The other tool is the tracker. This one works a little different. You start it at some point of your application, and ask it to give you a diff at some other. It prints a report of the objects created during that lapse and their size.
You use it like this (taken from the docs):
tr = tracker.SummaryTracker()
function_without_side_effects()
tr.print_diff()
Quite easy to setup, and you can know which objects remain in memory for a given chunk of code.
Memory-profiler
memory-profiler, unlike pympler, has some dependencies. I had to install tk and matplotlib on my system, along with psutil. This tool, however, can give you the memory consumption of your application per line or against time. This helped me to find where my performance peaks were. At the beginning i had something like this:
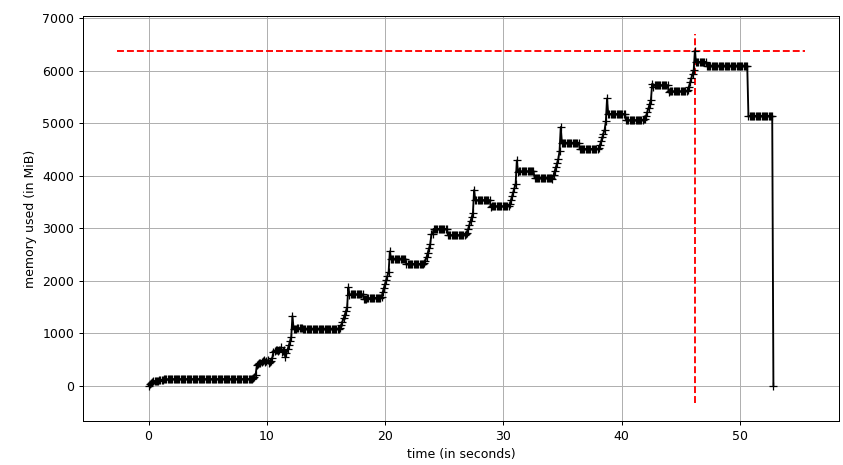
Horrible, right? I had a function to display an image on a widget, but every time it was updating the image to display, it was keeping a reference to the old one. It is easy to correlate that situation with the graphic. It just kept wasting memory.
Once you know what the problem is, it is easier to solve (most of the time). I fixed it and now my memory behaves like this:
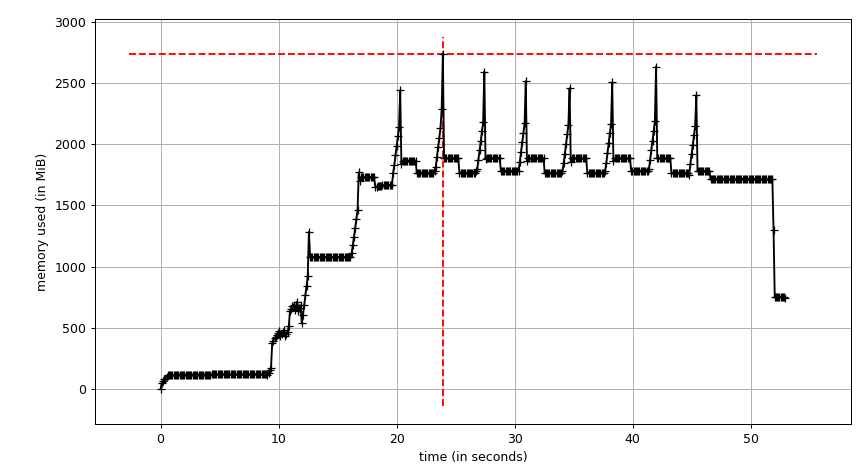
Basically the widget stopped wasting my memory, with the maximum now being less than the half on the previous analysis. The “peaks” are correlated with the way I am loading the image into the application. I have to create a copy, change it’s format and pass it to the widget, but once that’s done, that memory is released. My application is no longer dependent on the number of images.
In the end, most of the optimization came down to adding a line of code to clear old references, but the tools to diagnose the issue were vital to understand my problem and get a clear view of my application’s performance and behavior.